Contents
>>>>>>>
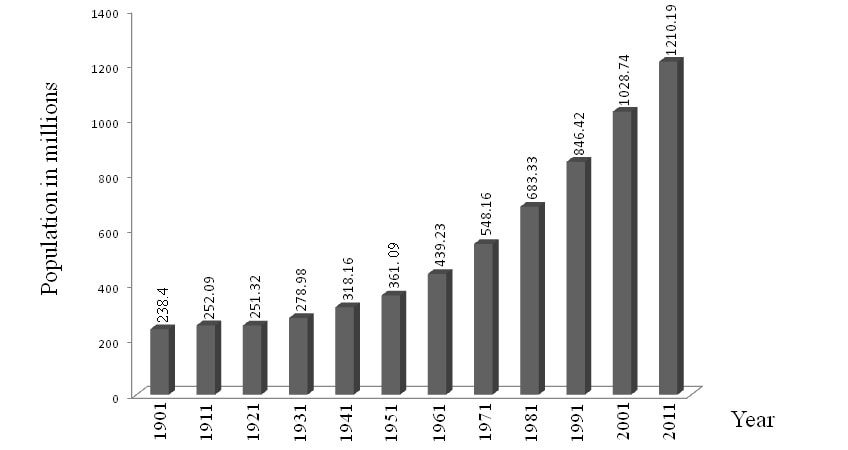
- Census in India conducted 15 times, as of 2011.
- After 1949, it conducted by the Registrar General and Census Commissioner of India under the Ministry of Home Affairs.
- All census conducted under Census of India Act 1948
- Decennial growth of population was highest in Census – 1971 (24.8%)
- Annual growth rate is highest in Census – 1981 (2.22%)
- Decennial growth of population was lowest in Census – 1921 (-0.31%)
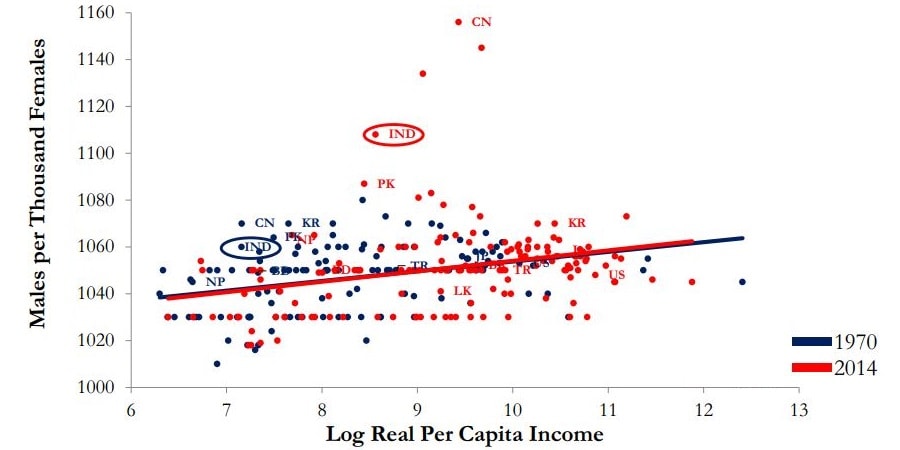
- India had the highest sex ratio in Census – 1901 (972)
- 2021 Census will be stored electronically, for 1st time.
- The Delimitation/reservation of Constituencies of Parliament, Assemblies, Panchayats and other Local Bodies is also done on the basis of the demographic data of the Census.
>>>>>>>
>>>>>>>
History of Census in India
- History of census in India can traced form ‘Arthashastr’ written by ‘Kautilya’ in the 3rd Century BC
- It prescribed the collection of population data as a measure of state policy for taxation.
- It contained a detailed description of methods of conducting population, economic and agricultural censuses.
- In the time of Mughal king Akbar, the administrative report ‘Ain-e-Akbari’ included comprehensive data pertaining to population, industry, wealth etc.
- 1st complete census of Indian city taken in Dacca in 1831 by Henry Walters.
- 1st all India census was conducted in 1872
- 1st complete and synchronous census was taken in 1881 by W.C. Plowden.
Sponsored


Census of India 1991
- Total population – 0.83 billion
- Decennial growth – 23.86%
- Annual growth – 2.16%
- Population density – 325 /km2
- Sex ratio – 927
- Child Sex Ratio (0- 6) – 945
- Literacy rate – 52.2
- Male Literacy rate – 64.1%
- Female Literacy rate – 39.3%
- Highest densely populated state – West Bengal (767)
Census of India 2001
- Total population – 1.02 billion
- Decennial growth – 21.34%
- Annual growth – 1.97%
- Population density – 325 /km2
- Sex ratio – 933
- Child Sex Ratio (0- 6) – 927
- Literacy rate – 64.8%
- Male Literacy rate – 75.3%
- Female Literacy rate – 53.7%
- Highest densely populated State – West Bengal (904)
- Highest decennial growth state – Nagaland (64%)
- Lowest decennial growth state – Kerala (9%)
Census of India 2011
- Total Population – 1.21 billion
- Total population of the world – 17.5%
- Below poverty level – 22% (as per Indian govt.-2012)
- Below poverty level – 23.6% (as per World Bank – $ 1.25 per day)
- No of districts – 640
- No of towns – 7,933
- No of villages – 6,40,930
- Decennial growth – 17.65%
- Annual growth – 1.64%
- Population density – 382 /km2
- Sex ratio – 943
- Rural Sex ratio – 949
- Urban Sex ratio – 929
- Child Sex Ratio (0- 6) – 919
- Child Sex Ratio Rural – 923
- Child Sex Ratio Urban – 905
- Literacy rate – 74.04%
- Male Literacy rate – 82.14%
- Female Literacy rate – 65.46%
- Highest Literate State – Kerala (94%)
- Lowest Literate State – Bihar (61.8%)
- Highest populated State – UP
- Highest densely populated state – Bihar
- Highest decennial growth state – Meghalaya
- Lowest decennial growth state – Nagaland
>>>>>>
Sponsored
>>>>>>
State wise Data of Census of India 2011
Most Populated States in India
| Rank | Highest State | Population | % of Total |
|---|---|---|---|
| 1 | Uttar Pradesh | 199812341 | 16.49% |
| 2 | Maharashtra | 112372972 | 9.28% |
| 3 | Bihar | 103804637 | 8.58% |
| 4 | West Bengal | 91347736 | 7.55% |
| 5 | Andhra Pradesh | 84580777 | 6.99% |
| 6 | Madhya Pradesh | 72597565 | 6% |
| Lowest State | |||
| 5 | Nagaland | 1980602 | 0.16% |
| 4 | Goa | 1457723 | 0.12% |
| 3 | Arunachal Pradesh | 1382611 | 0.11% |
| 2 | Mizoram | 1091014 | 0.09% |
| 1 | Sikkim | 607688 | 0.05% |
| UT | |||
| 1 | Delhi | 16787941 | 1.38% |
| 7 | Lakshadweep | 64429 | 0.01% |
Highest Decennial Population Growth
| Rank | Highest Population Growth | Growth % |
|---|---|---|
| 1 | Meghalaya | 27.8% |
| 2 | Arunachal Pradesh | 25.9% |
| 3 | Bihar | 25.1% |
| 4 | Jammu and Kashmir | 23.7% |
| 5 | Mizoram | 22.8% |
| Lowest Population Growth | Growth % | |
| 1 | Nagaland | -0.5% |
| 2 | Kerala | 4.9% |
| 3 | Goa | 8.2% |
| 4 | Andhra Pradesh | 11.1% |
| 5 | Sikkim | 12.4% |
| UT | Growth % | |
| 1 | Dadra and Nagar Haveli | 55.5% |
| 7 | Lakshadweep | 6.2% |
| India | 17.64% |
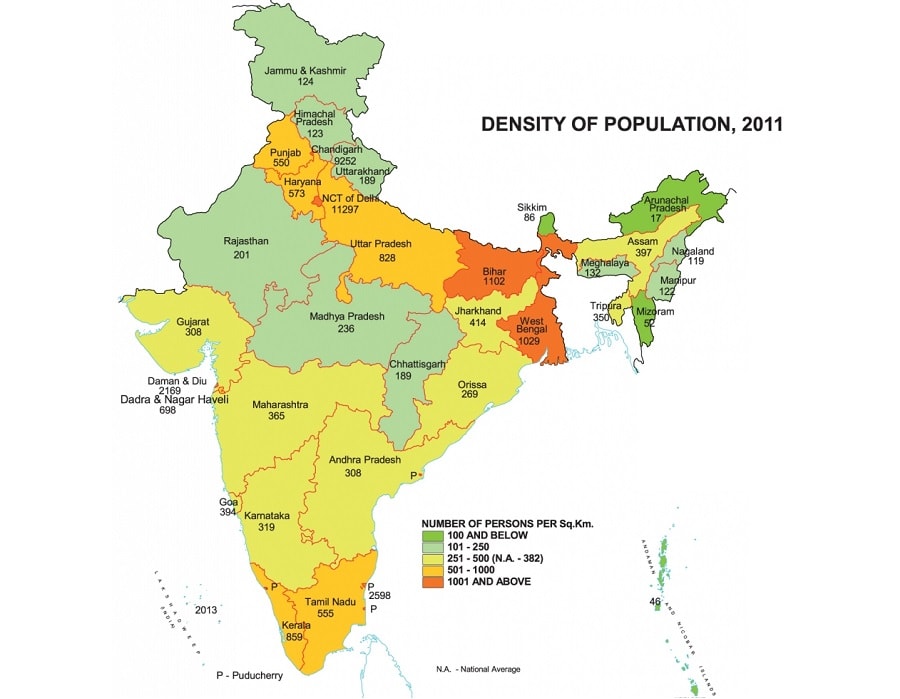
Densely Populated State in India
| Densely Populated States | Density/sq Km | |
|---|---|---|
| 1 | Bihar | 1102 |
| 2 | West Bengal | 1029 |
| 3 | Kerala | 859 |
| 4 | Uttar Pradesh | 828 |
| 5 | Haryana | 573 |
| Least Populated States | Density/sq Km | |
| 1 | Arunachal Pradesh | 17 |
| 2 | Mizoram | 52 |
| 3 | Jammu and Kashmir | 57 |
| 4 | Sikkim | 86 |
| UT | Density/sq Km | |
| 1 | Delhi | 11297 |
| 7 | Andaman and Nicobar Islands | 46 |
| India | 382 |
Largest State of India
| Largest State | Area Sq Km | |
|---|---|---|
| 1 | Rajasthan | 342239 |
| 2 | Madhya Pradesh | 308252 |
| 3 | Maharashtra | 307713 |
| 4 | Andhra Pradesh | 275045 |
| 5 | Uttar Pradesh | 240928 |
| Smallest State | Area Sq Km | |
| 1 | Goa | 3702 |
| 2 | Sikkim | 7096 |
| 3 | Tripura | 10486 |
>>>>>>
>>>>>>
Life Expectancy at Birth
| Best States | Life expectancy | |
|---|---|---|
| 1 | Kerala | 74.9 |
| 2 | Delhi | 73.2 |
| 3 | Jammu and Kashmir | 72.6 |
| 4 | Uttarakhand | 71.7 |
| 5 | Himachal Pradesh | 71.6 |
| India | 67.9 | |
| Worst States | ||
| 17 | Odisha | 65.8 |
| 18 | Chhattisgarh | 64.8 |
| 19 | Madhya Pradesh | 64.2 |
| 20 | Uttar Pradesh | 64.1 |
| 21 | Assam | 63.9 |
Sponsored
Rural & Urban Population
| States | Rural Population % | |
|---|---|---|
| 1 | Himachal Pradesh | 89.96% |
| 2 | Bihar | 88.70% |
| 3 | Assam | 85.92% |
| 4 | Odisha | 83.32% |
| 5 | Meghalaya | 79.92% |
| India | 68.84% | |
| States | Urban Population % | |
| 1 | Goa | 62.17% |
| 2 | Mizoram | 51.51% |
| 3 | Tamil Nadu | 48.45% |
| 4 | Kerala | 47.72% |
| 5 | Maharashtra | 45.23% |
| 6 | Gujarat | 42.58% |
| State | Urban Population | |
| 1 | Maharashtra | 8 cr. |
| 2 | Utter Pradesh | 6.7 cr. |
| 3 | Tamil Nadu | 5.3 cr. |
| UT | Urban Population % | |
| Delhi | 97.50% | |
| India | 31.16% |
Literacy Rate in India
| Highest Literacy Rate | Literacy % | |
|---|---|---|
| 1 | Kerala | 94.00% |
| 2 | Lakshadweep | 91.85% |
| 3 | Mizoram | 91.33% |
| 4 | Goa | 88.70% |
| 5 | Tripura | 87.22% |
| 19 | West Bengal | 76.26 % |
| Lowest Literacy Rate | Literacy % | |
| 1 | Bihar | 61.8 % |
| 2 | Arunachal Pradesh | 65.38 % |
| 3 | Rajasthan | 66.11 % |
| 4 | Jharkhand | 66.41 % |
| 5 | Andhra Pradesh | 67.02 % |
| India | 74.4 % |
Female Literacy Rate in India
| Highest Female Literacy | Literacy % | |
|---|---|---|
| 1 | Kerala | 92.07 % |
| 3 | Mizoram | 89.27 % |
| 2 | Lakshadweep | 87.95 % |
| 4 | Goa | 84.66 % |
| 5 | Tripura | 82.73 % |
| 18 | West Bengal | 70.54 % |
| Lowest Female Literacy | Literacy % | |
| 1 | Bihar | 51.5 % |
| 2 | Rajasthan | 52.12 % |
| 3 | Jharkhand | 55.42 % |
| 4 | Jammu and Kashmir | 56.43 % |
| 5 | Uttar Pradesh | 57.18 % |
Sponsored
Sex Ratio in India – State wise
| Highest Sex Ratio | Female/1000 Male | |
|---|---|---|
| 1 | Kerala | 1084 |
| 2 | Tamil Nadu | 995 |
| 3 | Andhra Pradesh | 993 |
| 4 | Chhattisgarh | 991 |
| 5 | Telangana | 988 |
| 16 | West Bengal | 950 |
| Lowest Sex Ratio | Female/1000 Male | |
| 1 | Haryana | 877 |
| 2 | Jammu and Kashmir | 883 |
| 3 | Sikkim | 889 |
| 4 | Punjab | 893 |
| 5 | Uttar Pradesh | 908 |
| UT | Female/1000 Male | |
| 1 | Puducherry | 1038 |
| 7 | Daman and Diu | 618 |
| India | 943 |
>>>>>>
>>>>>>>
District Data of Census of India 2011
Largest District in India
| Rank | Largest District | State | Area (Sq Km) |
|---|---|---|---|
| 1 | Kachchh | Gujarat | 45652 |
| 2 | Leh | J & K | 45110 |
| 3 | Jaisalmer | Rajasthan | 39313 |
| 4 | Bikaner | Rajasthan | 28466 |
| 5 | Barmer | Rajasthan | 28393 |
| Smallest District | State | Area (Sq Km) | |
| 1 | Mahe | Puducherry | 9 |
| 2 | Central Delhi | Delhi | 23 |
| 3 | Lakshadweep | Lakshadweep | 32 |
| 4 | Yanam | Puducherry | 17 |
| 5 | New Delhi | Delhi | 35 |
Most Populated District in India
| Rank | Most Populated District | State | Population |
|---|---|---|---|
| 1 | Thane | Maharashtra | 11060148 |
| 2 | North 24 Parganas | West Bengal | 10009781 |
| 3 | Bangalore | Karnataka | 9621551 |
| 4 | Pune | Maharashtra | 9429408 |
| 5 | Mumbai Suburban | Maharashtra | 9356962 |
| 6 | South 24 Parganas | West Bengal | 8161961 |
| 7 | Barddhaman | West Bengal | 7717563 |
| 8 | Ahmadabad | Gujarat | 7214225 |
| 9 | Murshidabad | West Bengal | 7103807 |
| 10 | Jaipur | Rajasthan | 6626178 |
| Least Populated District | State | Population | |
| 1 | Dibang Valley | Arunachal Pradesh | 8004 |
| 2 | Anjaw | Arunachal Pradesh | 21167 |
| 3 | Lahul and Spiti | Himachal Pradesh | 31564 |
| 4 | Upper Siang | Arunachal Pradesh | 35320 |
| 5 | Nicobars | A & N | 36842 |
Sponsored
Densely Populated Districts
| Rank | Most Densely | State | Density (Sq Km) |
|---|---|---|---|
| 1 | North East Delhi | Delhi | 36155 |
| 2 | Central Delhi | Delhi | 27730 |
| 3 | East Delhi | Delhi | 27132 |
| 4 | Chennai | Tamil Nadu | 26553 |
| 5 | Kolkata | West Bengal | 24306 |
| Least Densely | State | Density (Sq Km) | |
| 1 | Dibang Valley | Arunachal Pradesh | 1 |
| 2 | Lahul and Spiti | Himachal Pradesh | 2 |
| 3 | Anjaw | Arunachal Pradesh | 3 |
| 4 | Leh | J & K | 3 |
| 5 | Upper Siang | Arunachal Pradesh | 5 |
Sex Ratio in India – District wise
| Rank | Highest Sex Ratio | State | Female/1000 Male |
|---|---|---|---|
| 1 | Mahe | Puducherry | 1184 |
| 2 | Almora | Uttarakhand | 1139 |
| 3 | Kannur | Kerala | 1136 |
| 4 | Pathanamthitta | Kerala | 1132 |
| 5 | Ratnagiri | Maharashtra | 1122 |
| Lowest Sex Ratio | State | Female/1000 Male | |
| 1 | Daman | Daman and Diu | 534 |
| 2 | Leh | Jammu and Kashmir | 690 |
| 3 | Tawang | Arunachal Pradesh | 714 |
| 4 | North Sikkim | Sikkim | 767 |
| 5 | Dadra and Nagar Haveli | Dadra and Nagar Haveli | 774 |
Literacy Rate in India – District wise
| Highest Literacy Rate | State | Literacy % | |
|---|---|---|---|
| 1 | Serchhip | Mizoram | 97.91 % |
| 2 | Aizawl | Mizoram | 97.89 % |
| 3 | Mahe | Puducherry | 97.87 % |
| 4 | Kottayam | Kerala | 97.21 % |
| 5 | Pathanamthitta | Kerala | 96.55 % |
| Lowest Literacy Rate | State | Literacy % | |
| 1 | Alirajpur | Madhya Pradesh | 36.1 % |
| 2 | Bijapur | Chhattisgarh | 40.86 % |
| 3 | Dantewada | Chhattisgarh | 42.12 % |
| 4 | Jhabua | Madhya Pradesh | 43.3 % |
| 5 | Nabarangapur | Orissa | 46.43 % |
>>>>>

>>>>>
Sponsored
Urban Area Census
- For the Census of India 2011, the definition of urban area is as follows
- All places with a municipality, corporation, cantonment board or notified town area committee, etc.
- All other places which satisfied the following criteria
- A minimum population of 5,000
- At least 75% of the male main working population engaged in non-agricultural pursuits
- A density of population of at least 400 persons per sq. km
>>>>>>
Largest Cities in India
| Metropolitan >10 Lac | State | Population | |
|---|---|---|---|
| 1 | Mumbai | Maharashtra | 18394912 |
| 2 | Delhi | Delhi | 16349831 |
| 3 | Kolkata | West Bengal | 14035959 |
| 4 | Chennai | Tamil Nadu | 8653521 |
| 5 | Bangalore | Karnataka | 8520435 |
| 6 | Hyderabad | Andhra Pradesh | 7674689 |
| 7 | Ahmedabad | Gujarat | 6361084 |
| 8 | Pune | Maharashtra | 5057709 |
| 9 | Surat | Gujarat | 4591246 |
| 10 | Kanpur | Uttar Pradesh | 2920496 |
| Total Metropolitan in India | 53 Metropolitan | ||
| City > 1 Lac | State | Population | |
| 1 | Mumbai | Maharashtra | 12442373 |
| 2 | Delhi | Delhi | 11034555 |
| 3 | Bangalore | Karnataka | 8443675 |
| 4 | Hyderabad | Andhra Pradesh | 6731790 |
| 5 | Ahmedabad | Gujarat | 5577940 |
| 6 | Chennai | Tamil Nadu | 4646732 |
| 7 | Kolkata | West Bengal | 4496694 |
| 8 | Surat | Gujarat | 4467797 |
| 9 | Pune | Maharashtra | 3124458 |
| 10 | Jaipur | Rajasthan | 3046163 |
| Total Cities in India | 498 Cities |
>>>>>>
>>>>>>
Socio Economic Caste Census
Religion Census
| Religion | % of Total Population | Estimated Population | State Majority |
|---|---|---|---|
| Hindu | 79.80% | 96.62 Cr. | 28 |
| Muslim | 14.23% | 17.22 Cr. | 2 |
| Christian | 2.30% | 2.78 Cr. | 4 |
| Sikh | 1.72% | 2.08 Cr. | 1 |
| Buddhist | 0.70% | 84.43 Lakhs | |
| Jain | 0.37% | 44.52 Lakhs | |
| Other Religion | 0.66% | 79.38 Lakhs | |
| Not Stated | 0.24% | 28.67 Lakhs |
State wise Religion Census
| State | Hindu % of Total | |
|---|---|---|
| Himachal Pradesh | 0.9517 | Highest |
| Muslim % of Total | ||
| Lakshadweep | 0.9658 | Majority |
| Jammu and Kashmir | 0.6831 | Majority |
| Assam | 0.3422 | |
| West Bengal | 0.2701 | |
| Kerala | 0.2656 | |
| Christian % of Total | ||
| Nagaland | 0.8793 | Majority |
| Mizoram | 0.8716 | Majority |
| Meghalaya | 0.7459 | Majority |
| Manipur | 0.4129 | |
| Arunachal Pradesh | 0.3026 | Majority |
| Buddhist % of Total | ||
| Sikkim | 0.2739 | |
| Arunachal Pradesh | 0.1177 | |
| Jain % of Total | ||
| Maharashtra | 0.0125 |
Sponsored
SC Population in India – State wise
| Highest Population in Total | SC Population | % of Total | |
|---|---|---|---|
| 1 | Uttar Pradesh | 41357608 | 0.207 |
| 2 | West Bengal | 21463270 | 0.235 |
| 3 | Bihar | 16567325 | 0.159 |
| 4 | Tamil Nadu | 14438445 | 0.2 |
| 5 | Andhra Pradesh | 13878078 | 0.164 |
| India | 201378372 | 0.166 | |
| Lowest Population | SC Population | % of Total | |
| Arunachal Pradesh | 0 | ||
| Nagaland | 0 | ||
| Highest Population in % | SC Population % | ||
| 1 | Punjab | 31.9% | |
| 2 | Himachal Pradesh | 25.2% | |
| 3 | West Bengal | 23.5% | |
| 4 | Uttar Pradesh | 20.7% | |
| 5 | Haryana | 20.2% | |
| 6 | Tamilnadu | 20.0% |
ST Population in India – State wise
| Rank | Highest Population in Total | ST Population | % of Total |
|---|---|---|---|
| 1 | Madhya Pradesh | 15316784 | 21.1% |
| 2 | Maharashtra | 10510213 | 9.4% |
| 3 | Orissa | 9590756 | 8.5% |
| 4 | Rajasthan | 9238534 | 13.5% |
| 5 | Gujrat | 8917174 | 14.8% |
| 6 | Jharkhand | 8645042 | 26.2% |
| 7 | Chhattisgarh | 1743277 | 6.8% |
| West Bengal | 5.8% | ||
| India | 104545716 | 8.6% | |
| Lowest ST Population | |||
| Punjab | 0 | ||
| Chandigarh | 0 | ||
| Haryana | 0 | ||
| Highest ST Population in % | % of Total | ||
| 1 | Mizoram | 94.4% | |
| 2 | Nagaland | 86.5% | |
| 3 | Meghalaya | 86.1% | |
| 4 | Arunachal Pradesh | 68.8% | |
| UT | % of Total | ||
| 1 | Lakshadeep | 94.8% |
Data Source
।।।।।